machine learning, neural network

Training neural net to emulate XNOR

In the last two posts we have shown how to encode, using Tensorflow, a neural network that behaves like the XNOR gate. However, it is a very unusual that we know, ahead of time, weights and biases. A much more common scenario is when we have number of inputs and the corresponding values, and wish to train a neural net to produce for each input the appropriate value. For us the inputs are (0, 0), (0, 1), (1, 0) and (1, 1). The values are 1, 0, 0, and 1. We have seen that a 2 layer deep neural network can emulate XNOR with high fidelity. Thus we could just create a 2 layer deep, 3 neuron network and attempt to train it. To facilitate some level of experimentation we create a function that produces a fully connected neural network layer.

def CreateLayer(X, width):
    W = tf.get_variable("W", [X.get_shape()[1].value, width], tf.float32)
    b = tf.get_variable("b", [width], tf.float32)
    return tf.nn.sigmoid(tf.add(tf.matmul(X, W), b))

The function creates X \times W + b input to a layer of neurons. Using X \times W instead W \times X allows us to specify n inputs (features) as a m \times n matrix. This is often easier than representing inputs as m columns each n high. Also, rather than creating variables directly, with tf.Variable, we use tf.get_variable. This allows variable sharing, as explained in Sharing Variables. It also can enhance display of the computation graph in TensorBoard, as explained in Hands on TensorBoard presentation.

We also create a training operation and a loss function that allows us to assess how well the current network is doing. Tensorflow offers a whole array of optimizers, but tf.train.AdamOptimizer is often a good choice. In order for the optimizer to push variables to a local minima we must create an optimizer operation. This is done by calling minimize method with a loss function. The loss function tells the optimizer how far it is from the ideal solution. We use the mean of squared errors as our loss function.

def CreateTrainigOp(model, learning_rate, labels):
    loss_op = tf.reduce_mean(tf.square(tf.subtract(model, labels)))
    train_op = tf.train.AdamOptimizer(learning_rate).minimize(loss_op)
    return train_op, loss_op

The above function returns the training and loss operations. The latter is used to track progress of the model towards the optimum. The final piece of code that needs to be written is the training code.

g = tf.Graph()
with g.as_default():
  X = tf.placeholder(tf.float32, [None, 2], name="X")
  y = tf.placeholder(tf.float32, [None, 1], name="y")
  with tf.variable_scope("layer1"):
    z0 = CreateLayer(X, 2)
  with tf.variable_scope("layer2"):
    z1 = CreateLayer(z0, 1)
  with tf.variable_scope("xnor"):
    training_op, loss_op = CreateTrainigOp(z1, 0.03, y)
  init_op = tf.global_variables_initializer()
  saver = tf.train.Saver()

X and y (line 3-4) are placeholders, which are going to be seeded with inputs and desired outputs. We specify the first dimension to be None to allow for arbitrary number of rows. In lines 5 – 10 we create a model. It consists of two, fully connected layers. The first layer has 2 neurons, the second consists of a single neuron. X is the input to the first layer, while the output of the first layer, z0, is the input to the second layer. The output of the second layer, z1 is what we wish to train to behave like the XNOR gate. To do so, in lines 9 and 10 we create a training operation and a loss op. Finally we create an operation to initialize all global variables and a session saver.

writer = tf.summary.FileWriter("/tmp/xnor_log", g)
loss_summ = tf.summary.scalar("loss", loss_op)

Before we run the training step we create a summary writer. We are going to use it to track the loss function. It can also be used to track weights, biases, images, and audio inputs. It also is an invaluable tool for visualizing data flow graph. The graph for our specific example is shown in Fig 1.

comp_graphFig 1. Data flow graph as rendered by tensorboard

In order to train our model we create two arrays representing features and labels (input values and the desired output). The training itself is done for 5,000 steps by the for loop. We feed the session all inputs and desired values, and run a training operation. What this does it runs the feed forward steps to compute z1 for the given inputs, weights and biases. These are then compared, using the loss function to the ideal responses, represented by y from these Tensorflow computes contributions all weights and biases make to the loss function. It uses the learning rate 0.03 to adjust them to make the loss smaller.

X_train = np.array([[0, 0], [0, 1], [1, 0], [1, 1],])
y_train = np.array([[1], [0], [0], [1]])

sess = tf.Session(graph=g)
sess.run(init_op)
for step in xrange(5000):
    feed_dict = {X: X_train, y: y_train}
    sess.run(training_op, feed_dict=feed_dict)
    if step % 10 == 0:
        writer.add_summary(
            sess.run(loss_summ, feed_dict=feed_dict), step)
save_path = saver.save(sess, '/tmp/xnor.ckpt')
sess.close()
print "Model trained. Session saved in", save_path

Once the training is complete we save the state of the session, close it and print the location of the single session checkpoint. The loss function, as recorded by the summary file writer, and rendered by TensorBoard, is shown in Fig 2.

loss
Fig 2. Loss function plotted by tensorboard.

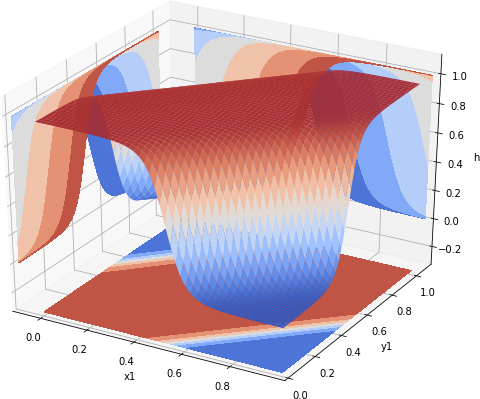
At the end of the training it the loss function has the value of 0.000051287. It was still dropping but very slowly. In the next post we show how to restore the session and plot the loss function as well as the output of the trained neural network.

Resources

The Jupyter notebook that implements the above discussed functionality is xnor-train.ipynb in the xnor-train project.

machine learning, neural network

Using XNOR trained model

In the previous post we have described how to train a simple neural net to emulate the XNOR gate. The results of the training are saved as a solitary session checkpoint. In this post we show how to re-create the model, load the weights and biases saved to the checkpoint and finally plot the surface generated by the neural net over [0,1] x [0,1] surface.

tf.reset_default_graph()
X = tf.placeholder(tf.float32, [None, 2], name="X")
with tf.variable_scope("layer1"):
  z0 = CreateLayer(X, 2)
with tf.variable_scope("layer2"):
  z1 = CreateLayer(z0, 1)

We start by re-creating the model. For convenience, we added tf.reset_default_graph() call. Otherwise an attempt to re-execute this particular Jupyter cell results in error. Just like during the training method we create a placeholder for input values. We do not need, however, a placeholder for the desired values, y. Next, we re-create the neural network, creating two, fully connected layers.

saver = tf.train.Saver()
sess = tf.Session()
saver.restore(sess, "/tmp/xnor.ckpt")

The next three lines create a saver, a session, and restore the state of the session from the saved checkpoint. In particular, this restores the trained values for weights and biases.

span = np.linspace(0, 1, 100)
x1, x2 = np.meshgrid(span, span)
X_in = np.column_stack([x1.flatten(), x2.flatten()])
xnor_vals = np.reshape(
    sess.run(z1, feed_dict={X: X_in}), x1.shape)
sess.close()
PlotValues(span, xnor_vals)

The final piece of the code creates a 100 x 100 mesh of points from the [0,1] x [0,1] range. These are then reshaped to the shape required by X placeholder. Next, the session runs z1 operation, which returns values computed by the neural net for the given input X. As these are returned as 10,000 x 1 vector, we reshape them back to the grid shape before assigning them to xnor_vals. Once the session is closed, the values are plotted, resulting in surface shown in Fig 1.

xnor-trained-hd
Fig 1. Values produced by the trained neural net

The surface significantly different from the plots produced by Andrew Ng’s neural network. However, both of them agree at the extremes. To plot the values at the corner of the plane we run the following code:

print " x1| x2| XNOR"
print "---+---+------"
print " 0 | 0 | %.3f" % xnor_vals[0][0]
print " 0 | 1 | %.3f" % xnor_vals[0][-1]
print " 1 | 0 | %.3f" % xnor_vals[-1][0]
print " 1 | 1 | %.3f" % xnor_vals[-1][-1]

The result is shown below

  x1 | x2| XNOR
 ---+---+------
  0 | 0 | 0.996
  0 | 1 | 0.005
  1 | 0 | 0.004
  1 | 1 | 0.997

As it can be seen, for the given inputs the training produced the desired output. The network produces values close to 1 for (0, 0) and (1, 1) and values close to 0 for (0, 1) and (1, 0). If the above code is run multiple times, since weights and biases are initialized randomly, sometimes the trained network produces results that resemble those produced by Andrew Ng’s network.

k-means, machine learning

Clustering

In Week 8 of Machine Learning Course, Andrew Ng introduces machine learning techniques for unlabeled data. These techniques allow one to discover patterns that exists in data, rather than train an algorithm to recognize an already known pattern. One algorithm frequently used to unearth natural grouping of data is k-means algorithm. When illustrating the workings of k-means algorithm for non-separated clusters Andrew Ng uses t-shirt sizing. Companies have to select, say four, t-shirt sizes, S, M, L, and XL. Each of the sizes has to accommodate some cluster of people. However, people do not come in discrete weight and height clumps. Instead, they form a continuum. We can see that by fetching some real-world data and using a scatter plot to show their distribution. Statistics Online Computational Resource (SOCR) provides a number of useful data sources. SOCR Data Dinov 020108 HeightsWeights set provides 25,000 records of human height and weight. For purposes of this tutorial we are going to rely on a smaller subset of 200 samples from that set. The distribution of data, plotted with matplotlib, is shown in Fig 1:

weight and height
Fig 1. Scatterplot of 200 samples of human weight and height.

There is no obvious clusters visible in Fig 1. If we had to manually draw them, chances are that our choice would be sub-optimal. This is where k-means cluster algorithm comes to the rescue. Its objective is to find clusters c_1, \ldots c_k such that their centroids \mu_1 \ldots \mu_k minimize the distance for each point x from the center of the cluster c(a(i)) to which it was assigned:

J(c_1, \ldots c_k, \mu_i \ldots \mu_k) = \dfrac{1}{m} \sum_{i = 1}^m ||x_i - \mu_{c(a(i))} ||

In version 1.0.x of Tensorflow a number of new contribution libraries were introduced. Among them is the KMeansClustering estimator. It can be used to solve the t-shirt sizing problem in just a few lines of code. First, we need to define a function that provides data to the estimator. As there are various classes of estimators, ranging from linear regression, through neural networks to k-means estimator, the input function must return both features and labels. For k-means the labels are all None:

import pandas as pd

hw_frame = pd.read_csv(
  './hw-data.txt', delim_whitespace=True,
  header=None, names=['Index', 'Height', 'Weight'])
hw_frame.drop('Index', 1, inplace=True)

def input_fn():
  return tf.constant(hw_frame.as_matrix(),
                     tf.float32, hw_frame.shape), None

To simplify our task we use Pandas Data Analysis Library to load and transform data. We first read the SOCR file, and drop the index column. Then use the loaded data to return a n \times 2 matrix as the first, feature component of the feature, labels pair.

Having constructed the input feed for the k-means estimator we create the estimator itself. We provide two parameters, the desired number of clusters and the loss tolerance. The second parameter allows us to let the estimator decide when to stop learning. When the loss function J changes by less than the supplied value, the estimator exits. Alternatively we could run it for some fixed number of steps.

tf.logging.set_verbosity(tf.logging.ERROR)
kmeans = tf.contrib.learn.KMeansClustering(
    num_clusters=4, relative_tolerance=0.0001)
_ = kmeans.fit(input_fn=input_fn)

Once the estimator is created we ask it to fit the data, which, in case of k-means algorithm results in four clusters. We assign the return of fit function to a dummy variable _ to avoid Jupyter printing it as the output of the cell. Method fit returns the estimator itself, allowing for chaining of calls.

Once the clusters were computed all that is left is extracting their centers and indexes for all features points

clusters = kmeans.clusters()
assignments = list(kmeans.predict_cluster_idx(input_fn=input_fn))

Clusters are returned as k \times n numpy.ndarray, where k is the number of clusters and n is the number of features (2 in our case). Method predict_cluster_idx returns an iterable that for for each feature row returns the index of the cluster to which it is allocated. The outcome for SOCR data is shown in Fig 2.

weight and height clustered
Fig 2. Scatterplot clusters computed by k-means algorithm.

Resources

You can download a Jupyter notebook with the above code from and SOCR data from github kmeans repository.

machine learning, svm

SVM with Tensorflow

Introduction

In lecture 12 Andrew Ng introduces support vector machines (SVMs). As Andrew Ng shows the intuition for what SVMs are can be gleaned from logistic regression. If we have a function h(x) = 1/(1 + e^{-\theta^T x}) that tells us how confident we are that a given x is a positive example, we wish to select \theta that results in h(x) \approx 1 for all positive examples. By the same token, we would like h(x) \approx 0 for all negative examples. The difference between the “least positive” and the “least negative” examples is the margin. By maximizing that margin we maximize the chances of yet unseen positive examples being recognized as such. The same holds for yet unseen negative examples. If we deal with linearly separable data, this is equivalent to finding a hyperplane (in case of 2D data, this is just a line) that maximizes the margin between positive and negative examples (see Fig 1)

separating hyperplane

Fig 1. Positive (red) and negative (blue) examples with the separating hyperplane (line) and its margins.

Without going into formalities, which are much better explained in Andrew Ng’s lecture notes, the task of finding such a hyperplane can be cast as task for finding support vectors for it. These can be efficiently found using gradient descent methods, with a slightly modified definition of the loss function.

SVM with Tensorflow

Tensorflow added, in version 1.0, tf.contrib.learn.SVM. It implements the Estimator interface. As with other estimators the approach is to create an estimator, fit known examples, while periodically evaluating the fitness of the estimator on the validation set. Once the evaluator is trained, it may be exported. From then on, for any new data, you use prediction to classify it.

Preparing Data

The first step is to prepare data, similar to the one shown in Fig 1. In real application this data would be collected from external sources, rather than generated. We generate a set of 1,000 random points. Each point is assigned a class. If for the given point (x, y), y > x the point is considered a part of a positive class. Otherwise, it falls into the negative class. As randomly generated points would not likely to have a margin separating positive from negative examples, we add the margin by pushing positive points (-\sqrt{1/2}, \sqrt{1/2}) left and up. Negative examples are pushed right and down by (\sqrt{1/2}, -\sqrt{1/2}).

min_y = min_x = -5
max_y = max_x = 5
x_coords = np.random.uniform(min_x, max_x, (500, 1))
y_coords = np.random.uniform(min_y, max_y, (500, 1))
clazz = np.greater(y_coords, x_coords).astype(int)
delta = 0.5 / np.sqrt(2.0)
x_coords = x_coords + ((0 - clazz) * delta) + ((1 - clazz) * delta)
y_coords = y_coords + (clazz * delta) + ((clazz - 1) * delta)

Preparing Input Function

For a given data we create an input function. The role of this function is to feed data and labels to the estimator. The data, for SVM, consist of a dictionary holding feature IDs, and features themselves. The labels tell the estimator the class to which each row of features belongs. In more complex setup the input function can return batches of data read from a disk or over a network. It can indicate the end of data by raising StopIteration or OutOfRangeError exception. For us the function trivially returns all 1,000 points with their labels.

def input_fn():
  return {
      'example_id': tf.constant(
          map(lambda x: str(x + 1), np.arange(len(x_coords)))),
      'x': tf.constant(np.reshape(x_coords, [x_coords.shape[0], 1])),
      'y': tf.constant(np.reshape(y_coords, [y_coords.shape[0], 1])),
  }, tf.constant(clazz)

Training SVM

Once the input function is set up, we create a new SVM estimator. In the constructor we tell it the names of the features, which for us are real valued columns. We also indicate which column holds the IDs for each row of features. Having done that we ask SVM to fit input data for a fixed number of steps. Since our data is trivially separable, we limit the number of steps to just 30. Next, we run one more step to estimate the quality of fit. For a trivial example the SVM achieves a perfect accuracy. In real application, the quality should be estimated on a data separate from the one used to train SVM.

feature1 = tf.contrib.layers.real_valued_column('x')
feature2 = tf.contrib.layers.real_valued_column('y')
svm_classifier = tf.contrib.learn.SVM(
  feature_columns=[feature1, feature2],
  example_id_column='example_id')
svm_classifier.fit(input_fn=input_fn, steps=30)
metrics = svm_classifier.evaluate(input_fn=input_fn, steps=1)
print "Loss", metrics['loss'], "\nAccuracy", metrics['accuracy']
Loss 0.00118758
Accuracy 1.0

Predicting Classes for New Data

Once SVM has been trained, it can be used to predict the class of a new, previously unseen data. To simulate this step we again generate random points and feed them to the trained SVM. SVM not only returns the class for each point, but gives us the logits value. The latter can be used to estimate the confidence in the class assigned to the point by the SVM. For example, a point (-0.27510791, -0.4940773) has class 0, and logits -0.28906667, indicating that it barely makes class 0. On the other hand (3.39027299, -2.13721821), which also belongs to class 0, has logits -7.00896215.

x_predict = np.random.uniform(min_x, max_x, (20, 1))
y_predict = np.random.uniform(min_y, max_y, (20, 1))

def predict_fn():
  return {
    'x': tf.constant(x_predict),
    'y': tf.constant(y_predict),
  }

pred = list(svm_classifier.predict(input_fn=predict_fn))
predicted_class = map(lambda x: x['classes'], pred)
annotations = map(lambda x: '%.2f' % x['logits'][0], pred)

The results of classification of random points, together with the logits values for each point are shown in Fig 2.

svm predictions

Fig 2. SVM prediction for a set of random points.

Resources

You can download the Jupyter notebook with the above code from a github svm repository.